Online Tool for Analysis of Series of Experiments in Randomized Block Designs
Generally, a single factor experiment is conducted over a number of locations/seasons/years for crop improvement programme with the objectives to study the performance of treatment effects over different locations/time in order to find treatments suitable for particular environment. The performance of a crops generally depends on treatment, environment and interactions treatment x environment. Pooled ANOVA is used to check the existence of treatment x environment interactions. Highly significant interactions indicate that the treatment interacted considerably with the environmental changes. In such cases where the experiment is repeated over time and combined analysis of data is carried out with following objectives
Ø To draw conclusions regarding the suitability of treatments
Ø A new variety of a crop or certain fertilizer dose is recommended only after conducting series of experiments
Ø To identify the technologies whose average effects over year are stable and high
Ø To reveal the differential response of the genotype to environmental changes
Ø To study the genetic diversity among the different genotypes used in an experiment
Ø To check whether the yield trends throughout the experimental period are not significantly different from zero.
Series of experiments are generally conducted in two ways
1. Over seasons/environments
2. Over years
Experiments over seasons/environments
For a given crop at a specific site, planting is usually not spread out uniformly over a 12-month period but is specifically bunched to determine the necessity of a separate technology recommendation for each planting season. For example, some crops are grown only once in a year but some crops can be grown two to three times in a year. The planting seasons usually remain distinct with respect to planting date and expected environmental features. In such experiments, the objective of a pooled analysis over seasons is to examine the interaction between season and treatment.
Experiments over years
The experiments conducted in seasons within a year, which are characterized by some distinct and predictable environmental features. But the variability of the environment over years is usually unpredictable. Because of the absence of any predictable pattern, years are generally considered as a random variable.. Hence the objective of a pooled analysis over years is to identify technologies whose average effect over years is stable and high. The interaction between treatment and year has no agronomic meaning and, therefore, is less important than the interaction between treatment and season. The procedure for pooled analysis is given below
1. Individual analysis for each season or year or location is carried out as per the design used
2. Compute the error mean square (MSE) values for each season or year or location
3. Test the homogeneity of these error variances using Hartley’s test and Bartlett’s chi square test depending upon the number of seasons/years
4. If the error variances are found to be homogeneous, pooled analysis is carried out
5. If the error variances are found to be heterogeneous, weighted analysis is carried out
The interpretation of results in two ways
1. When homogeneity of error variances is established:
a) Check the significance of season, treatment and interaction. If both treatment and its interaction with season/year found to be significant then it can be concluded there is a significant (yield) response to treatment but response differed between two seasons.
b) If the season × treatment interaction is significant, partition the interaction SS into a set of orthogonal contrasts that is most likely to provide information on the nature of the interaction; why the relative performance of the treatments differed over seasons.
2. When homogeneity of error variances is not established:
When the error variances are significantly different and the data are heterogeneous then transformation of data before doing the combined analysis is carried out. The transformation involves dividing each observation of each environment by the square root of Mean Square Error (MSE) of that environment.
This module provides pooled analysis over seasons and pooling over years. The output of the program includes
- Means of treatment for different seasons/years in a tabular form
- Separate analysis of variance for each season/year
- Bartlett’s test statistics with significance
- Separate analysis of variance for each season/year if transformation needed
- Combined analysis of variance for pooled data along with CD.
- Broad interpretation is also provided
Procedure for Pooled Analysis
Step 1: A data entry page has been developed where a user can input or paste the data as well as years/seasons name. The data for all the replications of first treatment for first year/season must be entered in first line/row and are separated by at least a single space. After entering the data, the data for second treatment of first year/season is entered in similar manner as that of first treatment. Enter the data for all the treatments of first year/season. Enter the data for second, third year/season one after another. If you arrange the data in Excel or text editor then copy the data and paste it in the interface. For illustration, we use the dataset of varietal trial which was conducted to study the performance of nine new strains of quality mustard vis-a-vis 3 checks using an RCB design with three replications at each of the respective environments (centres) at Bathinda, Hisar, IARI New Delhi, Ludhiana, Navgaon and TERI, New Delhi. The seed yield in kg/ha recorded have been taken from the table 8.2 of the book “Statistical Analysis of Agricultural Experiments Part I: Single Factor Experiments” by Gupta et al. 2016) ICAR-IASRI, Library Avenue, Pusa, New Delhi.
Data of Grain yield of rice tested with five rates of nitrogen over two seasons
|
Environ |
Treat |
Replication |
Environ |
Treat |
Replication |
||||
|
1 |
2 |
3 |
1 |
2 |
3 |
||||
|
Bathinda |
1 |
1794 |
2014 |
2581 |
Hisar |
1 |
3286 |
2459 |
3286 |
|
2 |
1134 |
1736 |
1898 |
2 |
2518 |
2364 |
2364 |
||
|
3 |
718 |
764 |
880 |
3 |
757 |
993 |
875 |
||
|
4 |
1852 |
1551 |
1887 |
4 |
2553 |
2388 |
2884 |
||
|
5 |
2245 |
2361 |
2407 |
5 |
2908 |
2482 |
2884 |
||
|
6 |
1111 |
1065 |
1111 |
6 |
1797 |
1560 |
2033 |
||
|
7 |
1181 |
880 |
1528 |
7 |
1749 |
1537 |
1537 |
||
|
8 |
1644 |
1991 |
2060 |
8 |
1501 |
2317 |
2577 |
||
|
9 |
1551 |
1435 |
1991 |
9 |
1513 |
1608 |
2104 |
||
|
10 |
1968 |
1551 |
2569 |
10 |
2447 |
2459 |
2813 |
||
|
11 |
2662 |
2338 |
3056 |
11 |
2600 |
2884 |
2648 |
||
|
12 |
1065 |
1227 |
1343 |
12 |
1631 |
1466 |
1844 |
||
|
IARI New Delhi |
1 |
2600 |
2444 |
2711 |
Ludhiana |
1 |
1370 |
1209 |
1320 |
|
2 |
3289 |
2667 |
2889 |
2 |
904 |
729 |
1007 |
||
|
3 |
2756 |
2511 |
2400 |
3 |
858 |
942 |
839 |
||
|
4 |
2600 |
2444 |
2222 |
4 |
904 |
959 |
1155 |
||
|
5 |
2689 |
2422 |
2444 |
5 |
1438 |
1456 |
1695 |
||
|
6 |
2578 |
2400 |
2222 |
6 |
873 |
959 |
946 |
||
|
7 |
3178 |
3044 |
2889 |
7 |
848 |
639 |
643 |
||
|
8 |
3244 |
2911 |
3111 |
8 |
1668 |
1770 |
1607 |
||
|
9 |
2444 |
2222 |
2667 |
9 |
910 |
907 |
1081 |
||
|
10 |
3156 |
2978 |
2756 |
10 |
1558 |
1606 |
1705 |
||
|
11 |
2667 |
2267 |
2111 |
11 |
1508 |
1389 |
1447 |
||
|
12 |
2689 |
2444 |
2289 |
12 |
1280 |
1207 |
1256 |
||
|
Navgaon |
1 |
2233 |
2222 |
2222 |
TERI, New Delhi |
1 |
1666 |
1333 |
2222 |
|
2 |
2222 |
2444 |
2722 |
2 |
1611 |
1389 |
1944 |
||
|
3 |
2000 |
1778 |
1778 |
3 |
1389 |
1244 |
2056 |
||
|
4 |
2667 |
3289 |
3333 |
4 |
1511 |
1778 |
1889 |
||
|
5 |
2444 |
2000 |
2000 |
5 |
1644 |
1622 |
1711 |
||
|
6 |
1778 |
1889 |
1556 |
6 |
1833 |
1822 |
2111 |
||
|
7 |
1778 |
1722 |
1722 |
7 |
1788 |
2333 |
1711 |
||
|
8 |
3000 |
2889 |
3222 |
8 |
1644 |
2220 |
2220 |
||
|
9 |
1778 |
1611 |
1333 |
9 |
1889 |
1822 |
2444 |
||
|
10 |
3778 |
3667 |
3556 |
10 |
2000 |
1556 |
1356 |
||
|
11 |
3111 |
3111 |
3222 |
11 |
944 |
388 |
722 |
||
|
12 |
2222 |
2000 |
2222 |
12 |
1488 |
1400 |
1356 |
||
The entered data in the
data entry web page looks as under:- 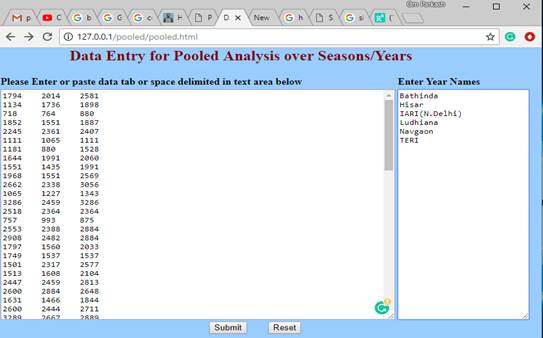
After entering the data and locations/years/seasons name press “Submit” button. Another web page will be displayed as given below:-
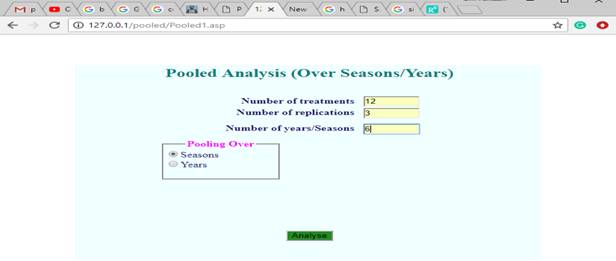
Step 2: Enter the number of treatments, number of replications and number of years/seasons in the text boxes provided. Also select seasons or year from the option buttons as per your requirements. After filling all the required information press “Analyse” button. The results will be displayed on separate web page.